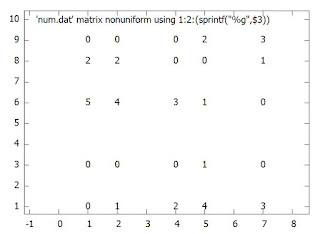
- first row contains the x-coordinate position
- first column contains the y-coordinate position

Lets pick an example matrix and the command. Lets plot with labels for easier understanding.
num.dat:

  ,1, 2, 4, 5, 7
6, 5, 4, 3, 1, 0
8, 2, 2, 0, 0, 1
3, 0, 0, 0, 1, 0
9, 0, 0, 0, 2, 3
1, 0, 1, 2, 4, 3

Command:

plot 'num.dat' matrix nonuniform using 1:2:(sprintf("%g",$3)) with labels
You can see the command 'matrix nonuniform'. If we use nonuniform, we explicitly mention it. If not, it will consider that as uniform.
Now, for making the graph colorful. Same matrix with palette style
gnuplot> plot 'num.dat' matrix nonuniform using 1:2:3 \
>with points pointtype 5 pointsize 8 linecolor palette
The different point parameters, make a similar heatmap kind of graph using point type 5(square) and palette.

No comments:
Post a Comment