We use the following data 'num.dat'
    ,Col1,Col2,Col3
Row1,	5,   4,   3
Row2,	2,   2,   5
Row3,	6,   3,   9
Row4,	9,   7,   3
Row5,	3,   1,   5
Boxes
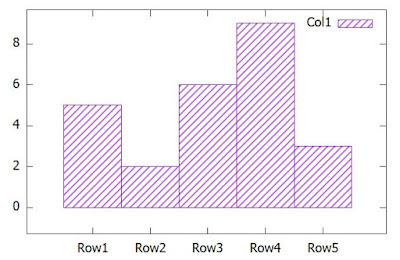
If a single column plot is needed, 'boxes' will be very helpful. The following commands.
set datafile separator ","
plot 'num.dat' using 2:xtic(1) with boxes fill pattern 5 title column
'using 2' means we plot only column 2. 'xtic(1)' means xtic labels will be from column 1. The resultant graph will be
Histogram Clustered
Clustered Histogram means putting all the columns side by side. We plot all the columns in the histogram graph. The following code:
set datafile separator ","
set style data histogram
set style histogram clustered
set style  fill pattern 4
plot for [COL=2:4] 'num.dat' using COL:xtic(1) title column
- data separator will be comma
- Setting the style to be histogram and the type clustered.
- Plotting the columns 2 to 4. Setting the column 1 entries as xtic labels.
Resultant graph will be

Histogram Rowstacked
In Rowstacked the rows are stacked one on top of another. Like adding the elements of rows. The following code is an example
set datafile separator ","
set style data histogram
set style histogram rowstacked
set style fill pattern 4
plot for [COL=2:4] 'num.dat' using COL:xtic(1) title column
The resultant graph will be

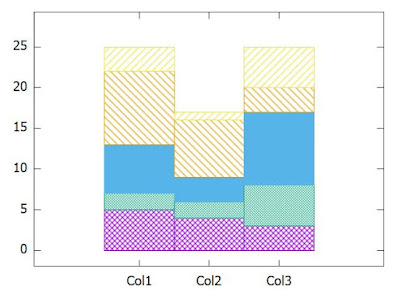
Histogram Columnstacked
In Columnstacked, we stack the columns into towers. The elements of the column are placed on top of another.
set datafile separator ","
set style data histogram
set style histogram columnstacked
set style  fill pattern 5
plot for [COL=2:4] 'num.dat' using COL title column
- Plot command is different. We do not use xtics. Only 'title column' would do the trick.
The resultant graph is
No comments:
Post a Comment