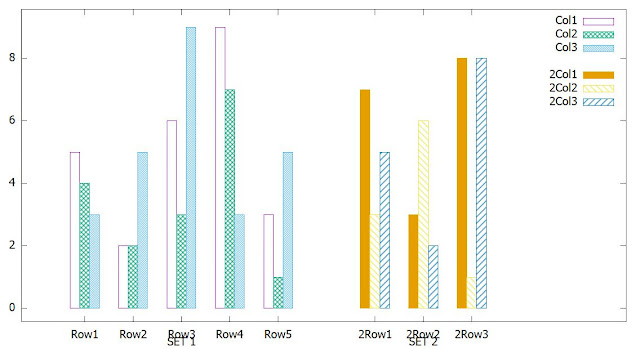
num.dat:

    ,Col1,Col2,Col3
Row1,	5,   4,   3
Row2,	2,   2,   5
Row3,	6,   3,   9
Row4,	9,   7,   3
Row5,	3,   1,   5

num2.dat:

    ,2Col1,2Col2,2Col3
2Row1,   7,    3,    5
2Row2,   3,    6,    2
2Row3,   8,    1,    8
Example script to demonstrate
set datafile separator ","
set style data histogram
set style histogram pattern 8
plot newhistogram 'SET 1', for [COL=2:4] 'num.dat' using COL:xtic(1) title column,\
 newhistogram 'SET 2', for [COL=2:4] 'num2.dat' using COL:xtic(1) title column
The command will be like joining two plots together. We can use line graph or histogram or any other with histogram. Usual syntax will be 'newhistogram <label>'.
In our script we had 2 separate plots. One for num.dat and other for num2.dat. We use the prefix 'newhistogram <label>' for both and join it in a single plot. The resultant graph will be:
No comments:
Post a Comment